Create Graph by using Chart Control in C#
Microsoft introduced Chart controls in Visual Studio 2010 to display the graph from given data. today we discussed how to create chart from Microsoft Excel Data. The Chart control is available in System.Windows.Forms.DataVisualization.dll.
Open Microsoft Visual Studio => Create new Windows Application and name it as CSharpCharts. Now drag and drop one Chart control, two buttons, one Label and one ComboBox. We have to provide data in X & Y coordinates to Chart control. So first create Point Class as shown below.
using System;
namespace CSharpCharts
{
public class Point
{
private Double _dIndex;
private Double _dValue;
public Point(Double X, Double Y)
{
_dIndex = X;
_dValue = Y;
}
public Double Index
{
get
{
return _dIndex;
}
set
{
_dIndex = value;
}
}
public Double Value
{
get
{
return _dValue;
}
set
{
_dValue = value;
}
}
public override bool Equals(object obj)
{
if (obj is Point)
{
Point p = (Point)obj;
return _dIndex == p._dIndex && +_dValue == p._dValue;
}
else
return false;
}
}
}
We have to import Excel data by using OpenFileDialog; display sheets in ComboBox and data in DataTable variable dtSheets. on Click on "Display Graph" the excel data binds to Chart1 control as shown below.
using System;
using System.Collections.Generic;
using System.Data;
using System.Data.OleDb;
using System.Windows.Forms;
using System.Windows.Forms.DataVisualization.Charting;
namespace CSharpCharts
{
public partial class Form1 : Form
{
private List<Point> _amerenPoints = new List<Point>();
List<Point> _decimationPoints = new List<Point>();
private string sFileName = string.Empty;
public Form1()
{
InitializeComponent();
}
private void Form1_Load(object sender, EventArgs e)
{
}
private void btnImport_Click(object sender, EventArgs e)
{
OpenFileDialog openFileDialog = new OpenFileDialog();
openFileDialog.CheckFileExists = true;
openFileDialog.AddExtension = true;
openFileDialog.Multiselect = true;
openFileDialog.Filter = "Excel files (*.xlsx)|*.xlsx";
if (openFileDialog.ShowDialog() == System.Windows.Forms.DialogResult.OK)
{
foreach (string fileName in openFileDialog.FileNames)
{
sFileName = fileName;
string connectionString = "Provider=Microsoft.ACE.OLEDB.12.0;Data Source=" + sFileName + ";Extended Properties=\"Excel 12.0 Xml;HDR=YES;IMEX=1\"";
OleDbConnection objConn = new OleDbConnection(connectionString);
objConn.Open();
DataTable dtSheets = objConn.GetOleDbSchemaTable(OleDbSchemaGuid.Tables, null);
objConn.Close();
cmbSheets.DataSource = dtSheets;
cmbSheets.DisplayMember = "TABLE_NAME";
cmbSheets.ValueMember = "TABLE_NAME";
}
}
}
private void LoadPoints(string sFileName)
{
this.Cursor = Cursors.WaitCursor;
try
{
string connectionString = "Provider=Microsoft.ACE.OLEDB.12.0;Data Source=" + sFileName + ";Extended Properties=\"Excel 12.0 Xml;HDR=YES;IMEX=1\"";
OleDbDataAdapter odad = new OleDbDataAdapter("SELECT * FROM [" + cmbSheets.Text + "]", connectionString);
DataSet ds = new DataSet();
odad.Fill(ds);
foreach (DataRow dr in ds.Tables[0].Rows)
{
_amerenPoints.Add(new Point(Convert.ToDouble(dr["Index"]), Convert.ToDouble(dr["Value"])));
}
LoadGraph(_amerenPoints);
Chart1.Visible = true;
}
catch (Exception ex)
{
MessageBox.Show(ex.Message);
}
this.Cursor = Cursors.Default;
}
private void LoadGraph(List<Point> listPoints)
{
Chart1.Series[0].ChartType = SeriesChartType.Line;
Chart1.Series[0].Name = "Excel Data";
double dXMax = 0;
double dXMin = 0;
double dYMax = 0;
double dYMin = 0;
foreach (Point point in listPoints)
{
Chart1.Series[0].Points.AddXY(Convert.ToDouble(point.Index), Convert.ToDouble(point.Value));
int iIndex = listPoints.IndexOf(point);
if (iIndex == 0 || Convert.ToDouble(point.Index) > dXMax)
{
dXMax = Convert.ToDouble(point.Index);
}
if (iIndex == 0 || Convert.ToDouble(point.Index) < dXMin)
{
dXMin = Convert.ToDouble(point.Index);
}
if (iIndex == 0 || Convert.ToDouble(point.Value) > dYMax)
{
dYMax = Convert.ToDouble(point.Value);
}
if (iIndex == 0 || Convert.ToDouble(point.Value) < dYMin)
{
dYMin = Convert.ToDouble(point.Value);
}
}
Chart1.ChartAreas[0].AxisX.Maximum = dXMax;
Chart1.ChartAreas[0].AxisX.Minimum = dXMin;
Chart1.ChartAreas[0].AxisY.Maximum = dYMax;
Chart1.ChartAreas[0].AxisY.Minimum = dYMin;
Chart1.DataBind();
}
private void btnGraphs_Click(object sender, EventArgs e)
{
_amerenPoints.Clear();
_decimationPoints.Clear();
Chart1.Series.Clear();
Chart1.ChartAreas.Clear();
Chart1.Series.Add("Series 0");
Chart1.ChartAreas.Add("ChartArea 0");
if (string.IsNullOrEmpty(sFileName) || cmbSheets.Items.Count == 0)
{
MessageBox.Show("Please select valid Excel File");
return;
}
else
{
LoadPoints(sFileName);
}
}
}
}
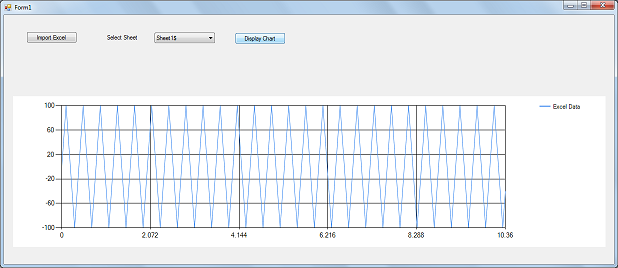
Execute the application and import the excel file by click on "Import Excel" button. The excel should have two columns with names as "Index" and "Value".
The output of the application is as shown below.

